NAME
Chart::Plotly::Trace::Surface - The data the describes the coordinates of the surface is set in `z`. Data in `z` should be a {2D array}. Coordinates in `x` and `y` can either be 1D {arrays} or {2D arrays} (e.g. to graph parametric surfaces). If not provided in `x` and `y`, the x and y coordinates are assumed to be linear starting at 0 with a unit step. The color scale corresponds to the `z` values by default. For custom color scales, use `surfacecolor` which should be a {2D array}, where its bounds can be controlled using `cmin` and `cmax`.
VERSION
version 0.020
SYNOPSIS
use Chart::Plotly qw(show_plot);
use Chart::Plotly::Trace::Surface;
use English qw(-no_match_vars);
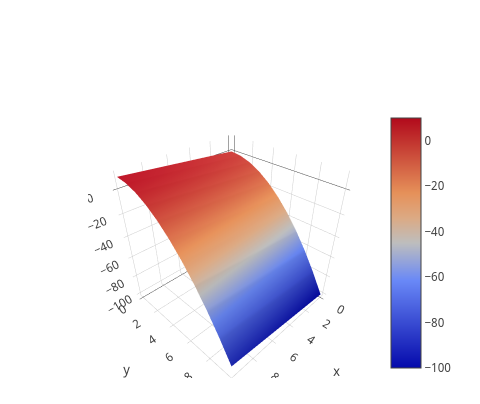
my $surface = Chart::Plotly::Trace::Surface->new(
x => [ 0 .. 10 ],
y => [ 0 .. 10 ],
z => [
map {
my $y = $ARG;
[ map { $ARG - $y * $y } ( 0 .. 10 ) ]
} ( 0 .. 10 )
]
);
show_plot( [$surface] );DESCRIPTION
The data the describes the coordinates of the surface is set in `z`. Data in `z` should be a {2D array}. Coordinates in `x` and `y` can either be 1D {arrays} or {2D arrays} (e.g. to graph parametric surfaces). If not provided in `x` and `y`, the x and y coordinates are assumed to be linear starting at 0 with a unit step. The color scale corresponds to the `z` values by default. For custom color scales, use `surfacecolor` which should be a {2D array}, where its bounds can be controlled using `cmin` and `cmax`.
Screenshot of the above example:
This file has been autogenerated from the official plotly.js source.
If you like Plotly, please support them: https://plot.ly/ Open source announcement: https://plot.ly/javascript/open-source-announcement/
Full reference: https://plot.ly/javascript/reference/#surface
DISCLAIMER
This is an unofficial Plotly Perl module. Currently I'm not affiliated in any way with Plotly. But I think plotly.js is a great library and I want to use it with perl.
METHODS
TO_JSON
Serialize the trace to JSON. This method should be called only by JSON serializer.
type
Trace type.
ATTRIBUTES
autocolorscale
Determines whether or not the colorscale is picked using the sign of the input z values.
cauto
Determines the whether or not the color domain is computed with respect to the input data.
cmax
Sets the upper bound of color domain.
cmin
Sets the lower bound of color domain.
colorbar
colorscale
Sets the colorscale. The colorscale must be an array containing arrays mapping a normalized value to an rgb, rgba, hex, hsl, hsv, or named color string. At minimum, a mapping for the lowest (0) and highest (1) values are required. For example, `[[0, 'rgb(0,0,255)', [1, 'rgb(255,0,0)']]`. To control the bounds of the colorscale in z space, use zmin and zmax
contours
customdata
Assigns extra data each datum. This may be useful when listening to hover, click and selection events. Note that, *scatter* traces also appends customdata items in the markers DOM elements
customdatasrc
Sets the source reference on plot.ly for customdata .
hidesurface
Determines whether or not a surface is drawn. For example, set `hidesurface` to *false* `contours.x.show` to *true* and `contours.y.show` to *true* to draw a wire frame plot.
hoverinfo
Determines which trace information appear on hover. If `none` or `skip` are set, no information is displayed upon hovering. But, if `none` is set, click and hover events are still fired.
hoverinfosrc
Sets the source reference on plot.ly for hoverinfo .
hoverlabel
ids
Assigns id labels to each datum. These ids for object constancy of data points during animation. Should be an array of strings, not numbers or any other type.
idssrc
Sets the source reference on plot.ly for ids .
legendgroup
Sets the legend group for this trace. Traces part of the same legend group hide/show at the same time when toggling legend items.
lighting
lightposition
name
Sets the trace name. The trace name appear as the legend item and on hover.
opacity
Sets the opacity of the surface.
reversescale
Reverses the colorscale.
scene
Sets a reference between this trace's 3D coordinate system and a 3D scene. If *scene* (the default value), the (x,y,z) coordinates refer to `layout.scene`. If *scene2*, the (x,y,z) coordinates refer to `layout.scene2`, and so on.
selectedpoints
Array containing integer indices of selected points. Has an effect only for traces that support selections. Note that an empty array means an empty selection where the `unselected` are turned on for all points, whereas, any other non-array values means no selection all where the `selected` and `unselected` styles have no effect.
showlegend
Determines whether or not an item corresponding to this trace is shown in the legend.
showscale
Determines whether or not a colorbar is displayed for this trace.
stream
surfacecolor
Sets the surface color values, used for setting a color scale independent of `z`.
surfacecolorsrc
Sets the source reference on plot.ly for surfacecolor .
text
Sets the text elements associated with each z value. If trace `hoverinfo` contains a *text* flag and *hovertext* is not set, these elements will be seen in the hover labels.
textsrc
Sets the source reference on plot.ly for text .
transforms
uid
visible
Determines whether or not this trace is visible. If *legendonly*, the trace is not drawn, but can appear as a legend item (provided that the legend itself is visible).
x
Sets the x coordinates.
xcalendar
Sets the calendar system to use with `x` date data.
xsrc
Sets the source reference on plot.ly for x .
y
Sets the y coordinates.
ycalendar
Sets the calendar system to use with `y` date data.
ysrc
Sets the source reference on plot.ly for y .
z
Sets the z coordinates.
zcalendar
Sets the calendar system to use with `z` date data.
zsrc
Sets the source reference on plot.ly for z .
AUTHOR
Pablo Rodríguez González <pablo.rodriguez.gonzalez@gmail.com>
COPYRIGHT AND LICENSE
This software is Copyright (c) 2018 by Pablo Rodríguez González.
This is free software, licensed under:
The MIT (X11) License