NAME
Chart::Plotly::Trace::Scatter3d - The data visualized as scatter point or lines in 3D dimension is set in `x`, `y`, `z`. Text (appearing either on the chart or on hover only) is via `text`. Bubble charts are achieved by setting `marker.size` and/or `marker.color` Projections are achieved via `projection`. Surface fills are achieved via `surfaceaxis`.
VERSION
version 0.020
SYNOPSIS
use Chart::Plotly qw(show_plot);
use Chart::Plotly::Trace::Scatter3d;
use English qw(-no_match_vars);
use Const::Fast;
const my $PI => 4 * atan2( 1, 1 );
const my $DELTA => 0.1;
my ( @x, @y, @z );
for ( my $u = 0; $u <= 2 * $PI; $u += $DELTA ) {
for ( my $v = -1; $v < 1; $v += $DELTA ) {
push @x, ( 1 + ( $v / 2 ) * cos( $u / 2 ) ) * cos($u);
push @y, ( 1 + ( $v / 2 ) * cos( $u / 2 ) ) * sin($u);
push @z, ( $v / 2 ) * sin( $u / 2 );
}
}
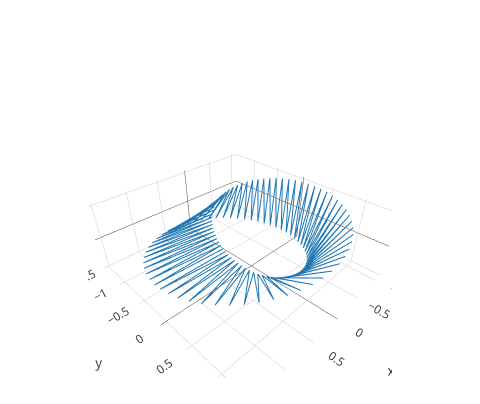
my $scatter3d = Chart::Plotly::Trace::Scatter3d->new( x => \@x, y => \@y, z => \@z, mode => 'lines' );
show_plot( [$scatter3d] );DESCRIPTION
The data visualized as scatter point or lines in 3D dimension is set in `x`, `y`, `z`. Text (appearing either on the chart or on hover only) is via `text`. Bubble charts are achieved by setting `marker.size` and/or `marker.color` Projections are achieved via `projection`. Surface fills are achieved via `surfaceaxis`.
Screenshot of the above example:
This file has been autogenerated from the official plotly.js source.
If you like Plotly, please support them: https://plot.ly/ Open source announcement: https://plot.ly/javascript/open-source-announcement/
Full reference: https://plot.ly/javascript/reference/#scatter3d
DISCLAIMER
This is an unofficial Plotly Perl module. Currently I'm not affiliated in any way with Plotly. But I think plotly.js is a great library and I want to use it with perl.
METHODS
TO_JSON
Serialize the trace to JSON. This method should be called only by JSON serializer.
type
Trace type.
ATTRIBUTES
connectgaps
Determines whether or not gaps (i.e. {nan} or missing values) in the provided data arrays are connected.
customdata
Assigns extra data each datum. This may be useful when listening to hover, click and selection events. Note that, *scatter* traces also appends customdata items in the markers DOM elements
customdatasrc
Sets the source reference on plot.ly for customdata .
error_x
error_y
error_z
hoverinfo
Determines which trace information appear on hover. If `none` or `skip` are set, no information is displayed upon hovering. But, if `none` is set, click and hover events are still fired.
hoverinfosrc
Sets the source reference on plot.ly for hoverinfo .
hoverlabel
hovertext
Sets text elements associated with each (x,y,z) triplet. If a single string, the same string appears over all the data points. If an array of string, the items are mapped in order to the this trace's (x,y,z) coordinates. To be seen, trace `hoverinfo` must contain a *text* flag.
hovertextsrc
Sets the source reference on plot.ly for hovertext .
ids
Assigns id labels to each datum. These ids for object constancy of data points during animation. Should be an array of strings, not numbers or any other type.
idssrc
Sets the source reference on plot.ly for ids .
legendgroup
Sets the legend group for this trace. Traces part of the same legend group hide/show at the same time when toggling legend items.
line
marker
mode
Determines the drawing mode for this scatter trace. If the provided `mode` includes *text* then the `text` elements appear at the coordinates. Otherwise, the `text` elements appear on hover. If there are less than 20 points, then the default is *lines+markers*. Otherwise, *lines*.
name
Sets the trace name. The trace name appear as the legend item and on hover.
opacity
Sets the opacity of the trace.
projection
scene
Sets a reference between this trace's 3D coordinate system and a 3D scene. If *scene* (the default value), the (x,y,z) coordinates refer to `layout.scene`. If *scene2*, the (x,y,z) coordinates refer to `layout.scene2`, and so on.
selectedpoints
Array containing integer indices of selected points. Has an effect only for traces that support selections. Note that an empty array means an empty selection where the `unselected` are turned on for all points, whereas, any other non-array values means no selection all where the `selected` and `unselected` styles have no effect.
showlegend
Determines whether or not an item corresponding to this trace is shown in the legend.
stream
surfaceaxis
If *-1*, the scatter points are not fill with a surface If *0*, *1*, *2*, the scatter points are filled with a Delaunay surface about the x, y, z respectively.
surfacecolor
Sets the surface fill color.
text
Sets text elements associated with each (x,y,z) triplet. If a single string, the same string appears over all the data points. If an array of string, the items are mapped in order to the this trace's (x,y,z) coordinates. If trace `hoverinfo` contains a *text* flag and *hovertext* is not set, these elements will be seen in the hover labels.
textfont
textposition
Sets the positions of the `text` elements with respects to the (x,y) coordinates.
textpositionsrc
Sets the source reference on plot.ly for textposition .
textsrc
Sets the source reference on plot.ly for text .
transforms
uid
visible
Determines whether or not this trace is visible. If *legendonly*, the trace is not drawn, but can appear as a legend item (provided that the legend itself is visible).
x
Sets the x coordinates.
xcalendar
Sets the calendar system to use with `x` date data.
xsrc
Sets the source reference on plot.ly for x .
y
Sets the y coordinates.
ycalendar
Sets the calendar system to use with `y` date data.
ysrc
Sets the source reference on plot.ly for y .
z
Sets the z coordinates.
zcalendar
Sets the calendar system to use with `z` date data.
zsrc
Sets the source reference on plot.ly for z .
AUTHOR
Pablo Rodríguez González <pablo.rodriguez.gonzalez@gmail.com>
COPYRIGHT AND LICENSE
This software is Copyright (c) 2018 by Pablo Rodríguez González.
This is free software, licensed under:
The MIT (X11) License