NAME
Chart::Plotly::Trace::Parcoords - Parallel coordinates for multidimensional exploratory data analysis. The samples are specified in `dimensions`. The colors are set in `line.color`.
VERSION
version 0.020
SYNOPSIS
use Chart::Plotly qw(show_plot);
use Chart::Plotly::Trace::Parcoords;
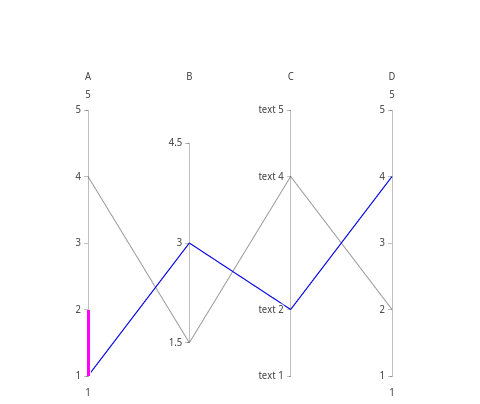
# Example data from: https://plot.ly/javascript/parallel-coordinates-plot/#adding-dimensions
my $parcoords = Chart::Plotly::Trace::Parcoords->new(
line=> {
color=> 'blue'
},
dimensions=> [{
range=> [1, 5],
constraintrange=> [1, 2],
label=> 'A',
values=> [1,4]
}, {
range=> [1,5],
label=> 'B',
values=> [3,1.5],
tickvals=> [1.5,3,4.5]
}, {
range=> [1, 5],
label=> 'C',
values=> [2,4],
tickvals=> [1,2,4,5],
ticktext=> ['text 1','text 2','text 4','text 5']
}, {
range=> [1, 5],
label=> 'D',
values=> [4,2]
}]
);
show_plot([ $parcoords ]);DESCRIPTION
Parallel coordinates for multidimensional exploratory data analysis. The samples are specified in `dimensions`. The colors are set in `line.color`.
Screenshot of the above example:
This file has been autogenerated from the official plotly.js source.
If you like Plotly, please support them: https://plot.ly/ Open source announcement: https://plot.ly/javascript/open-source-announcement/
Full reference: https://plot.ly/javascript/reference/#parcoords
DISCLAIMER
This is an unofficial Plotly Perl module. Currently I'm not affiliated in any way with Plotly. But I think plotly.js is a great library and I want to use it with perl.
METHODS
TO_JSON
Serialize the trace to JSON. This method should be called only by JSON serializer.
type
Trace type.
ATTRIBUTES
customdata
Assigns extra data each datum. This may be useful when listening to hover, click and selection events. Note that, *scatter* traces also appends customdata items in the markers DOM elements
customdatasrc
Sets the source reference on plot.ly for customdata .
dimensions
domain
hoverinfo
Determines which trace information appear on hover. If `none` or `skip` are set, no information is displayed upon hovering. But, if `none` is set, click and hover events are still fired.
hoverinfosrc
Sets the source reference on plot.ly for hoverinfo .
hoverlabel
ids
Assigns id labels to each datum. These ids for object constancy of data points during animation. Should be an array of strings, not numbers or any other type.
idssrc
Sets the source reference on plot.ly for ids .
labelfont
legendgroup
Sets the legend group for this trace. Traces part of the same legend group hide/show at the same time when toggling legend items.
line
name
Sets the trace name. The trace name appear as the legend item and on hover.
opacity
Sets the opacity of the trace.
rangefont
selectedpoints
Array containing integer indices of selected points. Has an effect only for traces that support selections. Note that an empty array means an empty selection where the `unselected` are turned on for all points, whereas, any other non-array values means no selection all where the `selected` and `unselected` styles have no effect.
showlegend
Determines whether or not an item corresponding to this trace is shown in the legend.
stream
tickfont
transforms
uid
visible
Determines whether or not this trace is visible. If *legendonly*, the trace is not drawn, but can appear as a legend item (provided that the legend itself is visible).
AUTHOR
Pablo Rodríguez González <pablo.rodriguez.gonzalez@gmail.com>
COPYRIGHT AND LICENSE
This software is Copyright (c) 2018 by Pablo Rodríguez González.
This is free software, licensed under:
The MIT (X11) License