NAME
Chart::Plotly::Trace::Cone - Use cone traces to visualize vector fields. Specify a vector field using 6 1D arrays, 3 position arrays `x`, `y` and `z` and 3 vector component arrays `u`, `v`, `w`. The cones are drawn exactly at the positions given by `x`, `y` and `z`.
VERSION
version 0.020
SYNOPSIS
 use Chart::Plotly qw(show_plot);
 use Chart::Plotly::Trace::Cone;

 my $cone = Chart::Plotly::Trace::Cone->new(
                 x => [1, 2],
                 y => [1, 2],
                 z => [1, 2],
                 u => [1, 2],
                 v => [1, 2],
                 w => [1, 2]
 );

 show_plot([ $cone ]);
DESCRIPTION
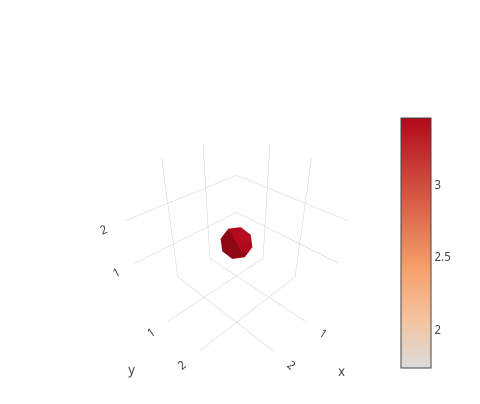
Use cone traces to visualize vector fields. Specify a vector field using 6 1D arrays, 3 position arrays `x`, `y` and `z` and 3 vector component arrays `u`, `v`, `w`. The cones are drawn exactly at the positions given by `x`, `y` and `z`.
Screenshot of the above example:
This file has been autogenerated from the official plotly.js source.
If you like Plotly, please support them: https://plot.ly/ Open source announcement: https://plot.ly/javascript/open-source-announcement/
Full reference: https://plot.ly/javascript/reference/#cone
DISCLAIMER
This is an unofficial Plotly Perl module. Currently I'm not affiliated in any way with Plotly. But I think plotly.js is a great library and I want to use it with perl.
METHODS
TO_JSON
Serialize the trace to JSON. This method should be called only by JSON serializer.
type
Trace type.
ATTRIBUTES
anchor
Sets the cones' anchor with respect to their x/y/z positions. Note that *cm* denote the cone's center of mass which corresponds to 1/4 from the tail to tip.
autocolorscale
Has an effect only if `color` is set to a numerical array. Determines whether the colorscale is a default palette (`autocolorscale: true`) or the palette determined by `colorscale`. In case `colorscale` is unspecified or `autocolorscale` is true, the default palette will be chosen according to whether numbers in the `color` array are all positive, all negative or mixed.
cauto
Has an effect only if `color` is set to a numerical array and `cmin`, `cmax` are set by the user. In this case, it controls whether the range of colors in `colorscale` is mapped to the range of values in the `color` array (`cauto: true`), or the `cmin`/`cmax` values (`cauto: false`). Defaults to `false` when `cmin`, `cmax` are set by the user.
cmax
Has an effect only if `color` is set to a numerical array. Sets the upper bound of the color domain. Value should be associated to the `color` array index, and if set, `cmin` must be set as well.
cmin
Has an effect only if `color` is set to a numerical array. Sets the lower bound of the color domain. Value should be associated to the `color` array index, and if set, `cmax` must be set as well.
colorbar
colorscale
Sets the colorscale and only has an effect if `color` is set to a numerical array. The colorscale must be an array containing arrays mapping a normalized value to an rgb, rgba, hex, hsl, hsv, or named color string. At minimum, a mapping for the lowest (0) and highest (1) values are required. For example, `[[0, 'rgb(0,0,255)', [1, 'rgb(255,0,0)']]`. To control the bounds of the colorscale in color space, use `cmin` and `cmax`. Alternatively, `colorscale` may be a palette name string of the following list: Greys, YlGnBu, Greens, YlOrRd, Bluered, RdBu, Reds, Blues, Picnic, Rainbow, Portland, Jet, Hot, Blackbody, Earth, Electric, Viridis, Cividis
customdata
Assigns extra data each datum. This may be useful when listening to hover, click and selection events. Note that, *scatter* traces also appends customdata items in the markers DOM elements
customdatasrc
Sets the source reference on plot.ly for customdata .
hoverinfo
Determines which trace information appear on hover. If `none` or `skip` are set, no information is displayed upon hovering. But, if `none` is set, click and hover events are still fired.
hoverinfosrc
Sets the source reference on plot.ly for hoverinfo .
hoverlabel
ids
Assigns id labels to each datum. These ids for object constancy of data points during animation. Should be an array of strings, not numbers or any other type.
idssrc
Sets the source reference on plot.ly for ids .
legendgroup
Sets the legend group for this trace. Traces part of the same legend group hide/show at the same time when toggling legend items.
lighting
lightposition
name
Sets the trace name. The trace name appear as the legend item and on hover.
opacity
Sets the opacity of the surface.
reversescale
Has an effect only if `color` is set to a numerical array. Reverses the color mapping if true (`cmin` will correspond to the last color in the array and `cmax` will correspond to the first color).
scene
Sets a reference between this trace's 3D coordinate system and a 3D scene. If *scene* (the default value), the (x,y,z) coordinates refer to `layout.scene`. If *scene2*, the (x,y,z) coordinates refer to `layout.scene2`, and so on.
selectedpoints
Array containing integer indices of selected points. Has an effect only for traces that support selections. Note that an empty array means an empty selection where the `unselected` are turned on for all points, whereas, any other non-array values means no selection all where the `selected` and `unselected` styles have no effect.
showlegend
Determines whether or not an item corresponding to this trace is shown in the legend.
showscale
Determines whether or not a colorbar is displayed for this trace.
sizemode
Sets the mode by which the cones are sized. If *scaled*, `sizeref` scales such that the reference cone size for the maximum vector magnitude is 1. If *absolute*, `sizeref` scales such that the reference cone size for vector magnitude 1 is one grid unit.
sizeref
Sets the cone size reference value.
stream
text
Sets the text elements associated with the cones. If trace `hoverinfo` contains a *text* flag and *hovertext* is not set, these elements will be seen in the hover labels.
textsrc
Sets the source reference on plot.ly for text .
transforms
u
Sets the x components of the vector field.
uid
usrc
Sets the source reference on plot.ly for u .
v
Sets the y components of the vector field.
visible
Determines whether or not this trace is visible. If *legendonly*, the trace is not drawn, but can appear as a legend item (provided that the legend itself is visible).
vsrc
Sets the source reference on plot.ly for v .
w
Sets the z components of the vector field.
wsrc
Sets the source reference on plot.ly for w .
x
Sets the x coordinates of the vector field and of the displayed cones.
xsrc
Sets the source reference on plot.ly for x .
y
Sets the y coordinates of the vector field and of the displayed cones.
ysrc
Sets the source reference on plot.ly for y .
z
Sets the z coordinates of the vector field and of the displayed cones.
zsrc
Sets the source reference on plot.ly for z .
AUTHOR
Pablo Rodríguez González <pablo.rodriguez.gonzalez@gmail.com>
COPYRIGHT AND LICENSE
This software is Copyright (c) 2018 by Pablo Rodríguez González.
This is free software, licensed under:
The MIT (X11) License