NAME
Chart::Plotly::Trace::Table - Table view for detailed data viewing. The data are arranged in a grid of rows and columns. Most styling can be specified for columns, rows or individual cells. Table is using a column-major order, ie. the grid is represented as a vector of column vectors.
VERSION
version 0.042
SYNOPSIS
use Chart::Plotly qw(show_plot);
use Chart::Plotly::Trace::Table;
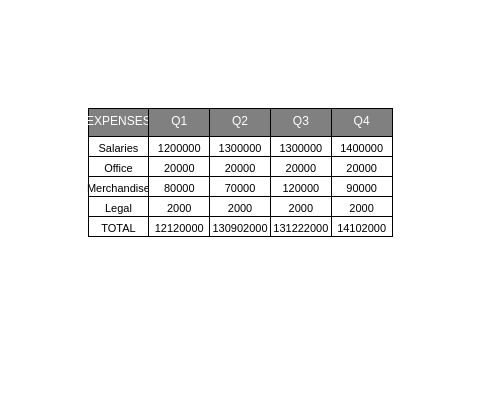
# Example data from: https://plot.ly/javascript/table/#basic-table
my $table = Chart::Plotly::Trace::Table->new(
header => {
values => [ [ "EXPENSES" ], [ "Q1" ],
[ "Q2" ], [ "Q3" ], [ "Q4" ] ],
align => "center",
line => { width => 1, color => 'black' },
fill => { color => "grey" },
font => { family => "Arial", size => 12, color => "white" }
},
cells => {
values => [
[ 'Salaries', 'Office', 'Merchandise', 'Legal', 'TOTAL' ],
[ 1200000, 20000, 80000, 2000, 12120000 ],
[ 1300000, 20000, 70000, 2000, 130902000 ],
[ 1300000, 20000, 120000, 2000, 131222000 ],
[ 1400000, 20000, 90000, 2000, 14102000 ] ],
align => "center",
line => { color => "black", width => 1 },
font => { family => "Arial", size => 11, color => [ "black" ] }
}
);
show_plot([ $table ]);DESCRIPTION
Table view for detailed data viewing. The data are arranged in a grid of rows and columns. Most styling can be specified for columns, rows or individual cells. Table is using a column-major order, ie. the grid is represented as a vector of column vectors.
Screenshot of the above example:
This file has been autogenerated from the official plotly.js source.
If you like Plotly, please support them: https://plot.ly/ Open source announcement: https://plot.ly/javascript/open-source-announcement/
Full reference: https://plot.ly/javascript/reference/#table
DISCLAIMER
This is an unofficial Plotly Perl module. Currently I'm not affiliated in any way with Plotly. But I think plotly.js is a great library and I want to use it with perl.
METHODS
TO_JSON
Serialize the trace to JSON. This method should be called only by JSON serializer.
type
Trace type.
ATTRIBUTES
cells
columnorder
Specifies the rendered order of the data columns; for example, a value `2` at position `0` means that column index `0` in the data will be rendered as the third column, as columns have an index base of zero.
columnordersrc
Sets the source reference on Chart Studio Cloud for `columnorder`.
columnwidth
The width of columns expressed as a ratio. Columns fill the available width in proportion of their specified column widths.
columnwidthsrc
Sets the source reference on Chart Studio Cloud for `columnwidth`.
customdata
Assigns extra data each datum. This may be useful when listening to hover, click and selection events. Note that, *scatter* traces also appends customdata items in the markers DOM elements
customdatasrc
Sets the source reference on Chart Studio Cloud for `customdata`.
domain
header
hoverinfo
Determines which trace information appear on hover. If `none` or `skip` are set, no information is displayed upon hovering. But, if `none` is set, click and hover events are still fired.
hoverinfosrc
Sets the source reference on Chart Studio Cloud for `hoverinfo`.
hoverlabel
ids
Assigns id labels to each datum. These ids for object constancy of data points during animation. Should be an array of strings, not numbers or any other type.
idssrc
Sets the source reference on Chart Studio Cloud for `ids`.
legendgrouptitle
legendrank
Sets the legend rank for this trace. Items and groups with smaller ranks are presented on top/left side while with `*reversed* `legend.traceorder` they are on bottom/right side. The default legendrank is 1000, so that you can use ranks less than 1000 to place certain items before all unranked items, and ranks greater than 1000 to go after all unranked items.
pmeta
Assigns extra meta information associated with this trace that can be used in various text attributes. Attributes such as trace `name`, graph, axis and colorbar `title.text`, annotation `text` `rangeselector`, `updatemenues` and `sliders` `label` text all support `meta`. To access the trace `meta` values in an attribute in the same trace, simply use `%{meta[i]}` where `i` is the index or key of the `meta` item in question. To access trace `meta` in layout attributes, use `%{data[n[.meta[i]}` where `i` is the index or key of the `meta` and `n` is the trace index.
metasrc
Sets the source reference on Chart Studio Cloud for `meta`.
name
Sets the trace name. The trace name appear as the legend item and on hover.
stream
uid
Assign an id to this trace, Use this to provide object constancy between traces during animations and transitions.
uirevision
Controls persistence of some user-driven changes to the trace: `constraintrange` in `parcoords` traces, as well as some `editable: true` modifications such as `name` and `colorbar.title`. Defaults to `layout.uirevision`. Note that other user-driven trace attribute changes are controlled by `layout` attributes: `trace.visible` is controlled by `layout.legend.uirevision`, `selectedpoints` is controlled by `layout.selectionrevision`, and `colorbar.(x|y)` (accessible with `config: {editable: true}`) is controlled by `layout.editrevision`. Trace changes are tracked by `uid`, which only falls back on trace index if no `uid` is provided. So if your app can add/remove traces before the end of the `data` array, such that the same trace has a different index, you can still preserve user-driven changes if you give each trace a `uid` that stays with it as it moves.
visible
Determines whether or not this trace is visible. If *legendonly*, the trace is not drawn, but can appear as a legend item (provided that the legend itself is visible).
AUTHOR
Pablo Rodríguez González <pablo.rodriguez.gonzalez@gmail.com>
COPYRIGHT AND LICENSE
This software is Copyright (c) 2022 by Pablo Rodríguez González.
This is free software, licensed under:
The MIT (X11) License